


Access to Opportunity
The Access to Opportunity section of the State Health Assessment describes some of the key factors that allow NH residents to reach their best mental, physical, social, spiritual, and emotional wellness. Many of these factors, such as education and housing stability, are called the “Social Determinants of Health.”
The key factors in this section selected to show how much access to opportunity NH residents have are:
- Education
- Economic Stability
- Food Security
- Housing Stability
- Internet Access
Below, we highlight data within each factor that illustrates what Access to Opportunity looks like in our state. We also highlight data from communities whose experience is very different from what the state-level data shows.
Whenever possible, we reference data that is centrally accessible in the NH Department of Health and Human Services Data Portal’s Social Determinants of Health dashboard. Data that cannot be found there are linked to where they can be found.
The data below primarily reflects the 2016-2020 American Community Survey results. These can be easily viewed by visiting the Social Determinants of Health section of the NH DHHS Data Portal. Additional data sources are hyperlinked throughout.
Key Findings
Key Findings
Overall, New Hampshire residents have a better experience than the U.S. as a whole in many areas that create access to opportunity. NH was ranked number 1 in the 2021 Social and Economic Factors in America’s Health Ranking, which looks at education, food security, housing, and other factors. However, significant differences exist when comparing data across demographic, geographic, and cultural groups.
What does Access to Opportunity look like in NH?
Educational attainment between communities varies, however NH is overall a well-educated state with high levels of high school graduation and college attendance. Many recent studies, including the 2021 Community Engagement Survey, have documented challenges families face in accessing high-quality early learning opportunities. Data below reflects the 2016-2020 American Community Survey results.
Adults over the age of 25 with a high school diploma, by selected demographics (2016-2020)

Adults with a four-year college degree, or higher, by selected demographics (2016-2020)

Improving access to quality education is essential

76% of respondents to the 2021 Community Engagement Survey believe
improving access to quality education is a high or essential priority for the state to address.
 Statewide data paints a positive picture of economic stability for NH residents. Our unemployment rate, which is lower than the national average, has returned to pre-COVID levels. Our median household income level is more than $17,000 higher than the national average, and 93% of people are living above the federal poverty level. Data below reflects the 2016-2020 American Community Survey results.
Below, we highlight a few of the NH communities who experience significantly different levels of economic stability.
People living below the poverty level, by selected demographics (2016-2020):

Median household income in the past 12 months, by selected demographics (2016-2020):

As of July 2022, the NH Employment Security reported a seasonally adjusted statewide unemployment rate of 2.2%. However, the 2016-2020 American Community Survey results highlights the gaps in employment across groups.
Unemployment rates, by selected demographics (2016-2020):

 Compared to the rest of the country, NH has relatively low levels of food insecurity. From 2017-2019, the USDA estimated that only 7% of NH families had a hard time getting adequate food because they did not have enough money or resources. Nationally, that estimate was 11% and 9% for New England overall.
 Food deserts
This map of NH from the USDA Food Access Research Atlas shows places in the state where accessing food is more difficult for some residents. The green shows communities where there are higher rates of people with low income AND who have to drive more than 10 miles to a grocery store. The yellow shows communities where there are higher proportions of residents have no access to a vehicle AND live further than 1/2 mile from a grocery store. Data below reflects the 2016-2020 American Community Survey results.

 As the COVID-19 pandemic job loss increased the number of people eligible for SNAP (food stamps) benefits, SNAP caseloads increased.
Over the course of the pandemic, caseloads peaked in May 2020 and leveled to baseline rates by the end of 2021.
 Housing availability and affordability are particularly important issues for the state, with rising housing costs and low vacancy rates. Vacancy rates are less than 1% across the state, and, in 2022, almost one half of renters (49%) spent more than 30% of their monthly income on housing – with almost one quarter (23%) spending more than 50%. Housing prices have steadily increased, with the statewide median purchase sitting at $302,333, and rent for a 2-bedroom apartment at $1,498.
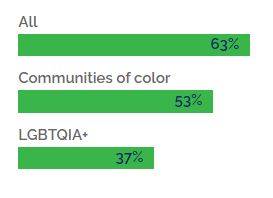
Homeownership by identity, as reported in the 2021 Community Engagement Survey:
Rates of homelessness per 10,000 people, by selected demographics (2007-2020):

Creating more affordable housing is essential
99% of respondents to the 2021 Community Engagement Survey who are students believe improving access to affordable housing is a high or essential priority for the state to address.
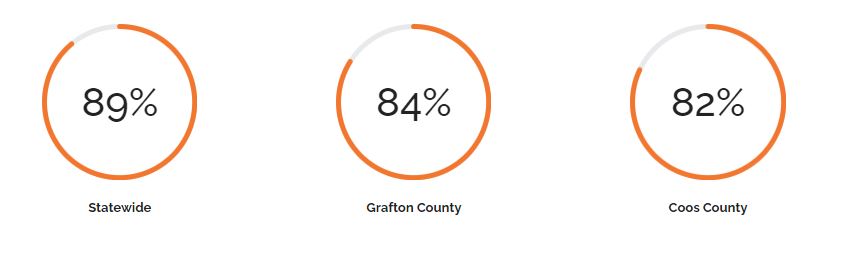
 While most of NH residents reports having access to a computer, reliable internet access is inconsistent across the state. COVID-19 increased our reliance on the internet to access important information and learning resources, contributing to a larger digital literacy divide between groups across the state. Below, we have included statewide data from the 2016-2020 American Community Survey. We also highlight communities with a different experience.

What do we still need to explore?
- What will the long-term impacts of COVID-19 be on fiscal health?
- Homelessness is not well-measured and portrays an incomplete picture of the problem given available data.
- Broadband access seems high, but measures of reliability and quality are lacking.
What resources exist to promote Access to Opportunity?
Education
Economic Stability
- NH Economic Recovery & Expansion Strategy
- NH State Development Plan
- Bureau of Family Assistance, Temporary Assistance to Needy Families (TANF)
- Division for Children, Youth and Families (DCYF)
- NH Cliff Analysis
Food Security
- Bureau of Family Assistance, Supplemental Nutrition Assistant Program (SNAP)
- Women, Infant & Children Nutrition Program
Housing Stability
- NH Housing Finance Authority
- U.S. Department of Housing and Urban Development
- Housing Insecurity – NH Council on Housing Stability
- State of New Hampshire 2021-2025 Consolidated Plan
- Council on Housing Stability Strategic Plan
Internet Access
Explore More
- American Community Survey | State and County Profiles
- American Community Survey: Educational Attainment Tables
- American Community Survey: Selected Economic Characteristics Table
- Bureau of Labor Statistics: NH Employment Data
- DHHS Data Portal
- National Alliance to End Homelessness: NH Homelessness Data
- NH Housing Finance Authority: Housing Cost Data
- WISDOM: Socioeconomic Status Measure Dashboard