

Identity
“Who are we?” is not a simple question to answer. Our identity as a group of people living within the New Hampshire borders is woven with layers of demographics ranging from how old we are, our zip code, our household size, how rural or urban our neighborhoods are considered, and so many more.
In this section of our State Health Assessment, we simplify the answer to the question of who we are by narrowing our focus on the core pieces of our identities that we carry from birth and have little ability to change:
- Population
- Age
- Sex and gender identity
- Race and ethnicity
- Physical or emotional attraction to others (sexual orientation)
- Physical ability
Other important things that define our state – the types of things that are impacted by what’s around us and the conditions in which we were raised – such as our economic prosperity, educational attainment, connectedness to community, and access to recreational or other social activities, will be described in detail in other sections of this State Health Assessment.
Key Findings
Key Findings
2020 Census Data illustrated significant shifts in demographic trends across many demographic categories. Where we live within our state borders, as well as our communities’ identities, have changed over the years. This has led to changes in the way communities must plan to support thriving, healthy people with social services, supports, infrastructure, health care, and countless other considerations.
- Population - Who Lives Here?
- Age
- Sex and Gender Identity
- Race and Ethnicity
- Physical or Emotional Attraction to Others (Sexual Orientation)
- Physical Ability
 According to the 2020 Census, New Hampshire is home to almost 1.4 million residents, which grew 4.6% since 2010. An analysis of the data by the UNH Carsey School of Public Policy identified that this change was mostly due to migration by people moving from other states. That change was occurring mostly in southern NH – which is closer to Boston and has better broadband access – as well as in recreational areas in central NH.
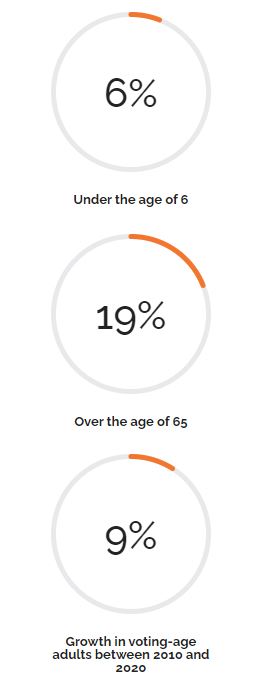
As of 2019, NH is the second oldest state in the U.S., with a median age of 43 years old, compared to the U.S. at 38 years old. The number of residents over the age of 50 has grown the most over the past ten years. In 2019, 18.7% of NH’s population was over the age of 65, and 4.4% was over the age of 80.
 The 2020 Census reports that sex in NH remains split fairly evenly (50.5% female, and 49.5% male). Limited data exists to estimate the number of NH residents who identify as a gender other than male or female, and often, the data that do exist combine gender and sexual orientation statistics.
 Non-binary gender
1.2% of Community Engagement Survey respondents report a
gender identity as something other than male or female.
NH has the fourth-highest proportion of white residents in the nation, with 87% of residents identifying as only white. However, our racial and ethnic diversity is growing in vibrance, which has been driven most prominently by children under the age of 18, the population of whom grew by 48% between 2010 and 2020.
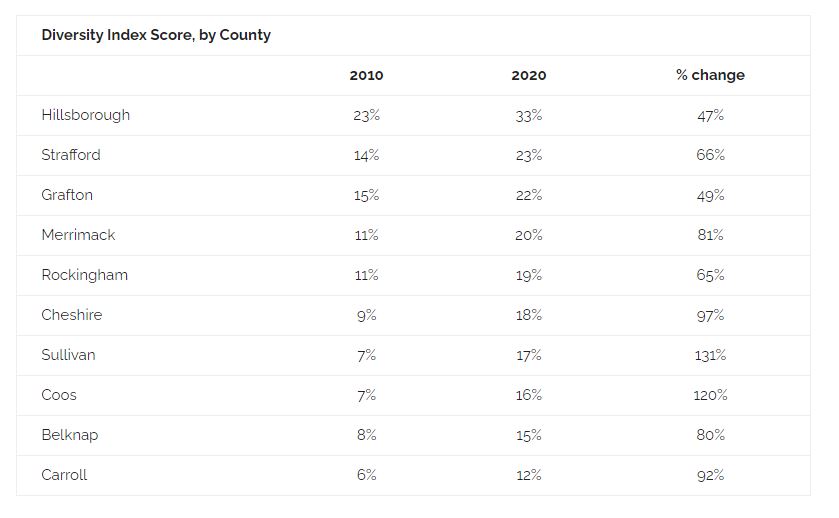
The US Census Bureau’s Diversity Index measures how likely that two random people will be from different racial or ethnic groups. NH’s Diversity Index score in 2020 was 24% – an increase from a score of 15% in 2010. The table below shows the most significant growth in diversity in Sullivan and Coos Counties, followed by Cheshire and Carroll.
Linguistic diversity has not followed the same trends, however, with virtually the same proportion of people (age 5+) speaking any language other than English in 2020 (8.1%) as in 2010 (8.0%). From 2016-2020, the two most common languages spoken other than English were were Spanish (13.2%) and “Other Indo-European” languages (3.7%).
As referenced above, limited systematic data collection efforts exist to provide a full, reliable picture of all of the ways NH people are attracted to others. 2020 Census data shows that only 1.5% of households led by a couple were led by couples of the same sex, but a 2019 Gallup/Williams Poll reported that 4.7% of NH adults identify as LGBT.*


*Note: We appreciate the imperfection and unintended insensitivity in collapsing gender identity and sexual orientation into a single category, and hope to promote more appropriate data collection methods in the future.
As of 2021, NH’s population of non-institutionalized residents with a disability mirrors the U.S. rate at 13%. This varies by county, ranging from 11% in Rockingham County to 21% in Coos County.
